library(ggraph)
library(tidygraph)
library(tidyverse)
library(igraph)
library(here)


# Load the graph
edges = read.csv('./following_graph.csv')
G = graph_from_data_frame(edges, directed = TRUE) |> as_tbl_graph()Ego Network of Bluesky Account
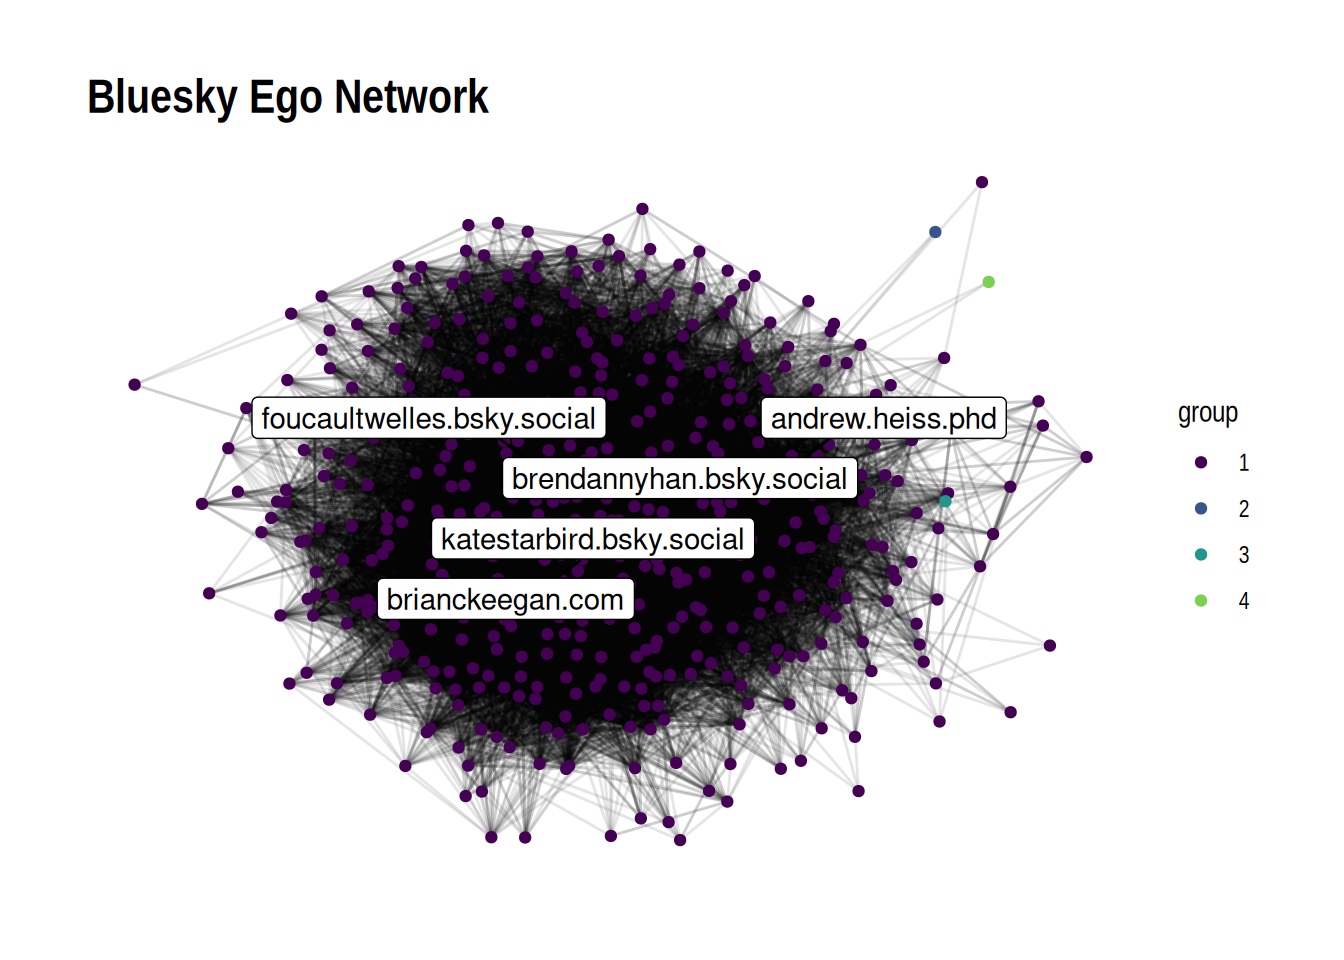
Now, let’s load the graph and do some quick visualizations in ggraph.
nodes_to_label = G |>
    activate(nodes) |>
    mutate(bc = centrality_betweenness()) |>
    as_tibble() |>
    arrange(desc(bc)) |>
    head(5) |>
    pull(name)

# Plot the graph
G |>
mutate(group = as.factor(group_label_prop())) |>
activate(edges) |>
ggraph() +
    geom_edge_link(alpha = .1) +
    geom_node_point(aes(color = group)) +
    geom_node_label(data = ~ filter(.x, name %in% nodes_to_label), aes(label=name), repel = TRUE) +
    theme_graph() +
    labs(title = "Bluesky Ego Network") +
    scale_color_viridis(discrete = TRUE, end = 0.8)