A new paper that our that our group has published seeks to test whether the kind of communication patterns associated with successful offline teams also predict success in online collaborative settings. Surprisingly, we find that it does not. In the rest of this blog post, we summarize that research and unpack that result.
Eight years ago, I left my job as a product manager and decided that I wanted to go back to school. During the next six months, I taught myself some basic Python and learned as much as a I could about Master’s degree programs studying “the Internet”. I was fortunate enough to learn about and be accepted into the Media, Technology, and Society program at Purdue, where I took my first courses in Communication (while simultaneously teaching my first courses in Communication!). I had an incredible advisor in Seungyoon Lee, and wonderful mentors like Sorin Matei, Lorraine Kisselburgh, and Torsten Reimer.
The ubiquity of large-scale data and improvements in computational hardware and algorithms have provided enabled researchers to apply computational approaches to the study of human behavior. One of the richest contexts for this kind of work is social media datasets like Facebook, Twitter, and Reddit.
Give students a basic understanding of how to do some fundamental data analysis tasks in R: importing, cleaning, visualizing, and modeling
Those are really big goals for only four hours. I decided to use the tidyverse as much as possible and not even teach base R syntax like ‘[,]’, apply, etc. I used the first session to show and explain code using the nycflights13 dataset. For the the second session we did a few more examples but mostly worked on exercises using a dataset from Wikia that I created (with help from Mako and Aaron Halfaker’s code and data).
As part of a “Computing Everywhere” course organized by Jeremy Birnholtz, I ran a two-hour lecture on Internet technologies with two different groups of students. Overall, I think that the classes went well, and I wanted to reflect a little bit about it, and make my materials available for anyone wanting to teach a similar class. The goal was to give students an intuitive understanding of the technologies that underpin the internet, and how they relate to security, privacy, etc.
In this post, I’ll show how simple getting social media data can be. I use the Twitter API to get some summary data about a list of users. A colleague is using this data for a project, and asked for some help in retrieving it, so I thought I would use my code as a tutorial.
This quarter, I’m a TA for my advisor’s undergraduate course, Online Communities and Crowds. We’ve been reading some of the classics of public goods production and common pool resources.
On Saturday at the IC2S2 conference, I saw a presentation about the decisions people would like autonomous cars to make when faced with moral dilemmas. Since then, I have seen quite a bit of coverage on the Science article by the same team.
Programs have bugs. Anyone who has written code for long enough learns that while most bugs are obvious (typos, indention problems, etc.) others are subtle, and difficult to detect. Professional developers spend a lot of their time writing tests in order to try to catch these bugs.
However, I have learned that, for the most part, scholars don’t write tests. I think that there are a number of good reasons for this: the programs they write are much simpler and can break in fewer ways, the code is only run a few times and rarely require input from external users, etc. Without good tests, though, bugs will happen, and can have disastrous results. For example, a paper by Harvard economists Reinhart and Rogoff contained a bug which changed their results and may have influenced worldwide financial policy.
<h3>Stopping Bugs</h3>How should scholars react to this? When learning how rare tests were, my knee-jerk reaction was that we should require scholars to write tests in the same way that professional developers write tests.
I do think that scholars should do much more to avoid bugs - they should review their code with others, write basic tests, and look at raw data (and distributions of raw data) to make sure that it looks reasonable.
However, I don’t think that we should hold academic code to the same standard as professional code, for a few reasons. First, because in a user-facing software environment, the software will be pushed to its limits, generally with far more variation in inputs, expected use cases, etc. This means that there are a lot of bugs which would matter in this environment which wouldn’t affect academic code (e.g., not sanitizing inputs). No matter how thorough testing is, bugs cannot be completely eliminated from complex code, but the optimal balance for professional code includes more testing than in an academic environment.
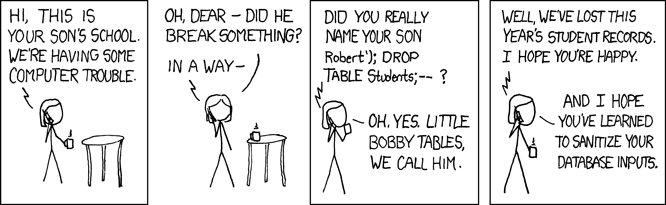
<table align="center" cellpadding="0" cellspacing="0" class="tr-caption-container" style="margin-left: auto; margin-right: auto; text-align: center;"><tbody><tr><td style="text-align: center;"></td></tr><tr><td class="tr-caption" style="text-align: center;">Obligatory XKCD comic</td></tr></tbody></table>Second, because the output of scholarly code isn’t a program, but an analysis. Rather, it is an argument intended to persuade the audience about the state of the world. Instead of eliminating bugs, readers can accept the reality of bugs when assessing arguments based on academic code.
<h3>Trusting Results Less</h3>But how should readers adjust their beliefs regarding research results that are produced in an environment that includes software bugs? In other words, are bugs more likely to produce stronger or weaker results (i.e., higher or lower p-values)?
Intuition says that any sort of error (such as a bug) should make results less reliable. However, ceteris paribus, we should actually expect results that are weaker than reality. Researchers include measures that they believe are correlated with outcomes. We should expect accidental/noisy deviations from our intended measures (such as those from a subtle bug) to have a weaker correlation with outcomes.
However, research doesn’t happen in a vacuum, and there is a human in the middle. When researchers see results that are unexpected (either in the wrong direction or non-significant), they are likely to examine the data and code to try to understand why (and are therefore more likely to find bugs). On the other hand, when results line up with their expectations, researchers are unlikely to probe further, and bugs which push results in the expected direction are therefore more likely to remain unexposed.
The overall effect on the p-value is dependent on the likelihood of having a bug, the likelihood that the bug increases the p-value estimate, the likelihood of searching for the bug, and the likelihood of finding the bug. If we call the true p-value p and the estimate of the p-value p̂ we could model the likelihood of an underestimate of the p-value (i.e., thinking an effect is stronger than it actually is) as:
P(p̂ < p) = P(bug exists) * P(p̂ < p | bug exists) * (1 - P(search for bug | p̂ < p) * P(find bug | search for bug)) * (1 - P(search for bug | p̂ < p) * P(find bug | search for bug)) is 1 - the probability that a bug is found; in other words, the probability that a bug is not found and remains in the published results.
The likelihood of an overestimate (i.e., thinking an effect is weaker than it is) is:
P(p̂ > p) = P(bug exists) * P(p̂ > p | bug exists) * P(search for bug | p̂ > p) * P(find bug | search for bug)
The argument is that P(p̂ > p | bug exists) > P(p̂ < p | bug exists), but P(search for bug | p̂ > p) > P(search for bug | p̂ < p). That is, it’s more likely that bugs increase p-value estimates, but also more likely that they are searched for.
Which outcome is more likely depends on each of the probabilities, but a rough example is illustrative. If we assume that bugs exist in 20% of projects, that 70% of the time they increase p-value estimates (and 30% of the time decrease them), that 80% of the time when they increase p-value estimates they are searched for (and 0% of the time when they decrease p-values), and that they are found 80% of the time they are searched for, then:
In other words, 6% of studies would have underestimates of p-values, and ~5% would have overestimates.
<h3>Conclusion </h3>So, what should we take from this? First, that researchers should do a better job with testing. Simple tests plus eyeballing of results can catch a lot of bugs, including the most egregious bugs which are most likely to distort results.
Second, that even if researchers do more tests, bugs will still exist and that’s OK. As readers, we should just take the results of computational research projects with a grain of salt. Assuming my estimates of probabilities are reasonably close to reality (a very courageous assumption) suggests that the likelihood of both Type I and Type II errors is actually quite a bit higher than statistical parameters would imply. That is, we should trust both significant and null results a bit less.
As a kid, I was fascinated by the idea of self-driving cars. This may be the very definition of a nerdy child, but I remember sitting awake one night, thinking about how self-driving cars might work. All of my schemes involved a centralized computer that would be aware of where every car was, and would calculate ahead of time when collisions might occur, and make minor adjustments to vechicle speeds to avoid them.
However, the actual self-driving cars which are coming are very different from what I envisioned. Instead of operating via a centralized “hive mind”, each car operates autonomously and locally, without any direct knowledge about other cars. Instead of a centralized knowledge about the whole system, they each gather their own information about their local environment, and operate in a decentralized way, with only local knowledge of their portion of the system.
There are some reasons for this, some of which can point toward general principles for when systems are better as decentralized and when they are better centralized:
<ul><li>There are important aspects of the environment which are unknown. A centralized system doesn’t know about cyclists or children running into the road, or debris, etc.</li><li>Centralized systems create a single point of failure. If there is a bug in the system, all cars are affected. A bug in a single car (or even a single model) is much less catastrophic</li><li>Centralized systems are less adaptable. If you decide that you don’t want to go to that restaurant after all, and you’d rather just go to Wendy’s, with a local system, your car simply adjusts its route accordingly. With a centralized system, an adjustment to one car propagates through the system, and hundreds or thousands of route adjustments need to be calculated and applied (similarly every time someone starts a new route or there is an accident, etc.). These are complex optimizations problems which can be approximated by local systems without all of the overhead.</li></ul><div>I think that the eventual system of transportation will be a mix of local and centralized. As I understand it, current cars have access to centralized maps, and I can imagine that the richness of the sort of data that can be centralized will grow: information about when lights will change, information about traffic jams, even information about the destination of other cars in the area. However, for the reasons outlined above, I think that these will be information systems, not decision systems. They will always be accompanied by a rich understanding of the local situation, with the actual decision making done at that level.</div>
I learned a neat trick today. One of those things that once you learn it, you wonder how/why you were so long without it.
I’ve been working on revising my thesis to try to publish it as a few papers. Because it’s such a long paper, I have a ‘thesis.tex’ file, which is basically a bunch of include statements, to include each of the chapters. As I’m editing it, I open each chapter in a tab in vim, and until today, whenever I wanted to recompile the PDF, I would move to the ‘thesis.tex’ tab and recompile from there.
So, today I found out that you can set up a .tex file as a “main” file, so that when you ‘\ll’ to compile your .tex code, it will compile that file, instead of the file you’re currently looking at.
So, importing data into RSiena is a bit of a pain. The GUI has some support for importing Pajek files, for example, but I’ve been working mostly from the command line, and with .R files, which are what the manual covers.
For my current project, I have CSV files in a very common edgelist format, something like -
<pre>sourceID,receiverID,weight,wave </pre> I think it should be simple to import these into RSiena, but it isn’t.
RSiena accepts either adjacency matrices - which are matrices with a 0 or 1 in each spot, for each node - or sparse matrices. These are similar to edgelists, but they have to be in the dgTMatrix class. As you can tell by reading the documentation, it’s not exactly obvious how to get the data into that format.
I started by trying the Matrix() function, then I found the sparseMatrix() function. I realized that weight didn’t matter, so I simply ignored the weight column. This creates a sparse matrix of the type “ngCMatrix”, which is a “pattern matrix”, and can’t be coerced to a dgTMatrix.
So, eventually, I ended up creating a new weight column, with everything set to 1, and reset to 1 if there are duplicate entries in the data.
My current code is below:
<pre style="background-image: URL(http://2.bp.blogspot.com/_z5ltvMQPaa8/SjJXr_U2YBI/AAAAAAAAAAM/46OqEP32CJ8/s320/codebg.gif); background: #f0f0f0; border: 1px dashed #CCCCCC; color: black; font-family: arial; font-size: 12px; height: auto; line-height: 20px; overflow: auto; padding: 0px; text-align: left; width: 99%;"> edgeListToAdj <- function(x, waveID){ # Remove entries who are not connect to anyone (NomineeID == 0), and not the # current wave tempNet <- x[x$NomineeID > 0 & x$NomineeID <= nodeCount & x$Wave == waveID,] # Create a binary column for weights (since RSiena doesn't use weights). tempNet$Weight <- 1 # Convert network obejct to adjacency matrix adjacencyMat <- sparseMatrix(tempNet$NomineeID, tempNet$RespondentID, x=tempNet$Weight, dims=c(nodeCount,nodeCount)) # If any items appear more than once, re-binarize them. # Yes, binarize is a real word. adjacencyMat[adjacencyMat > 1] <- 1 # Convert to a dgTMatrix, since this is what RSiena expects return(as(adjacencyMat, "dgTMatrix")) } createNetwork <- function(fileName, numWaves) { print(fileName) # Convert CSV file to data frame netDF <- as.data.frame(read.csv(fileName)) # Create an array of adjacency networks net <- lapply(1:numWaves, function(x) edgeListToAdj(netDF, x)) # Change this into an RSiena network RSienaObj <- sienaDependent(net) return(RSienaObj) } </pre>
I made my first ever visit to Boston this past week, and while I was there, I was able to put together a small research project. On a subway ride, I carefully noted each of the interactions between the 50 riders in the train car I was in, during a 15 minute ride. Edge weight represents number of minutes spent talking to each other.
Nodes are colored based on degree centrality, sized based on eigenvector centrality, and spaced with Fruchterman-Reingold in Gephi.
<div class="separator" style="clear: both; text-align: center;"></div><div class="separator" style="clear: both; text-align: center;"> </div><div class="separator" style="clear: both; text-align: left;">So far, the research is merely descriptive, but I think some real insights could be made through running an actor-oriented model.</div><div class="separator" style="clear: both; text-align: left;"> </div><div class="separator" style="clear: both; text-align: left;">:)</div>
If you have used vim for very long, you have almost certainly made some modifications to your .vimrc file - this is the file that stores configurations for how vim does things like tabs, syntax highlighting, etc.
If you use more than one computer, I highly recommend keeping your .vimrc file on the cloud. It’s incredibly simple, and provides for a consistent experience across computers.
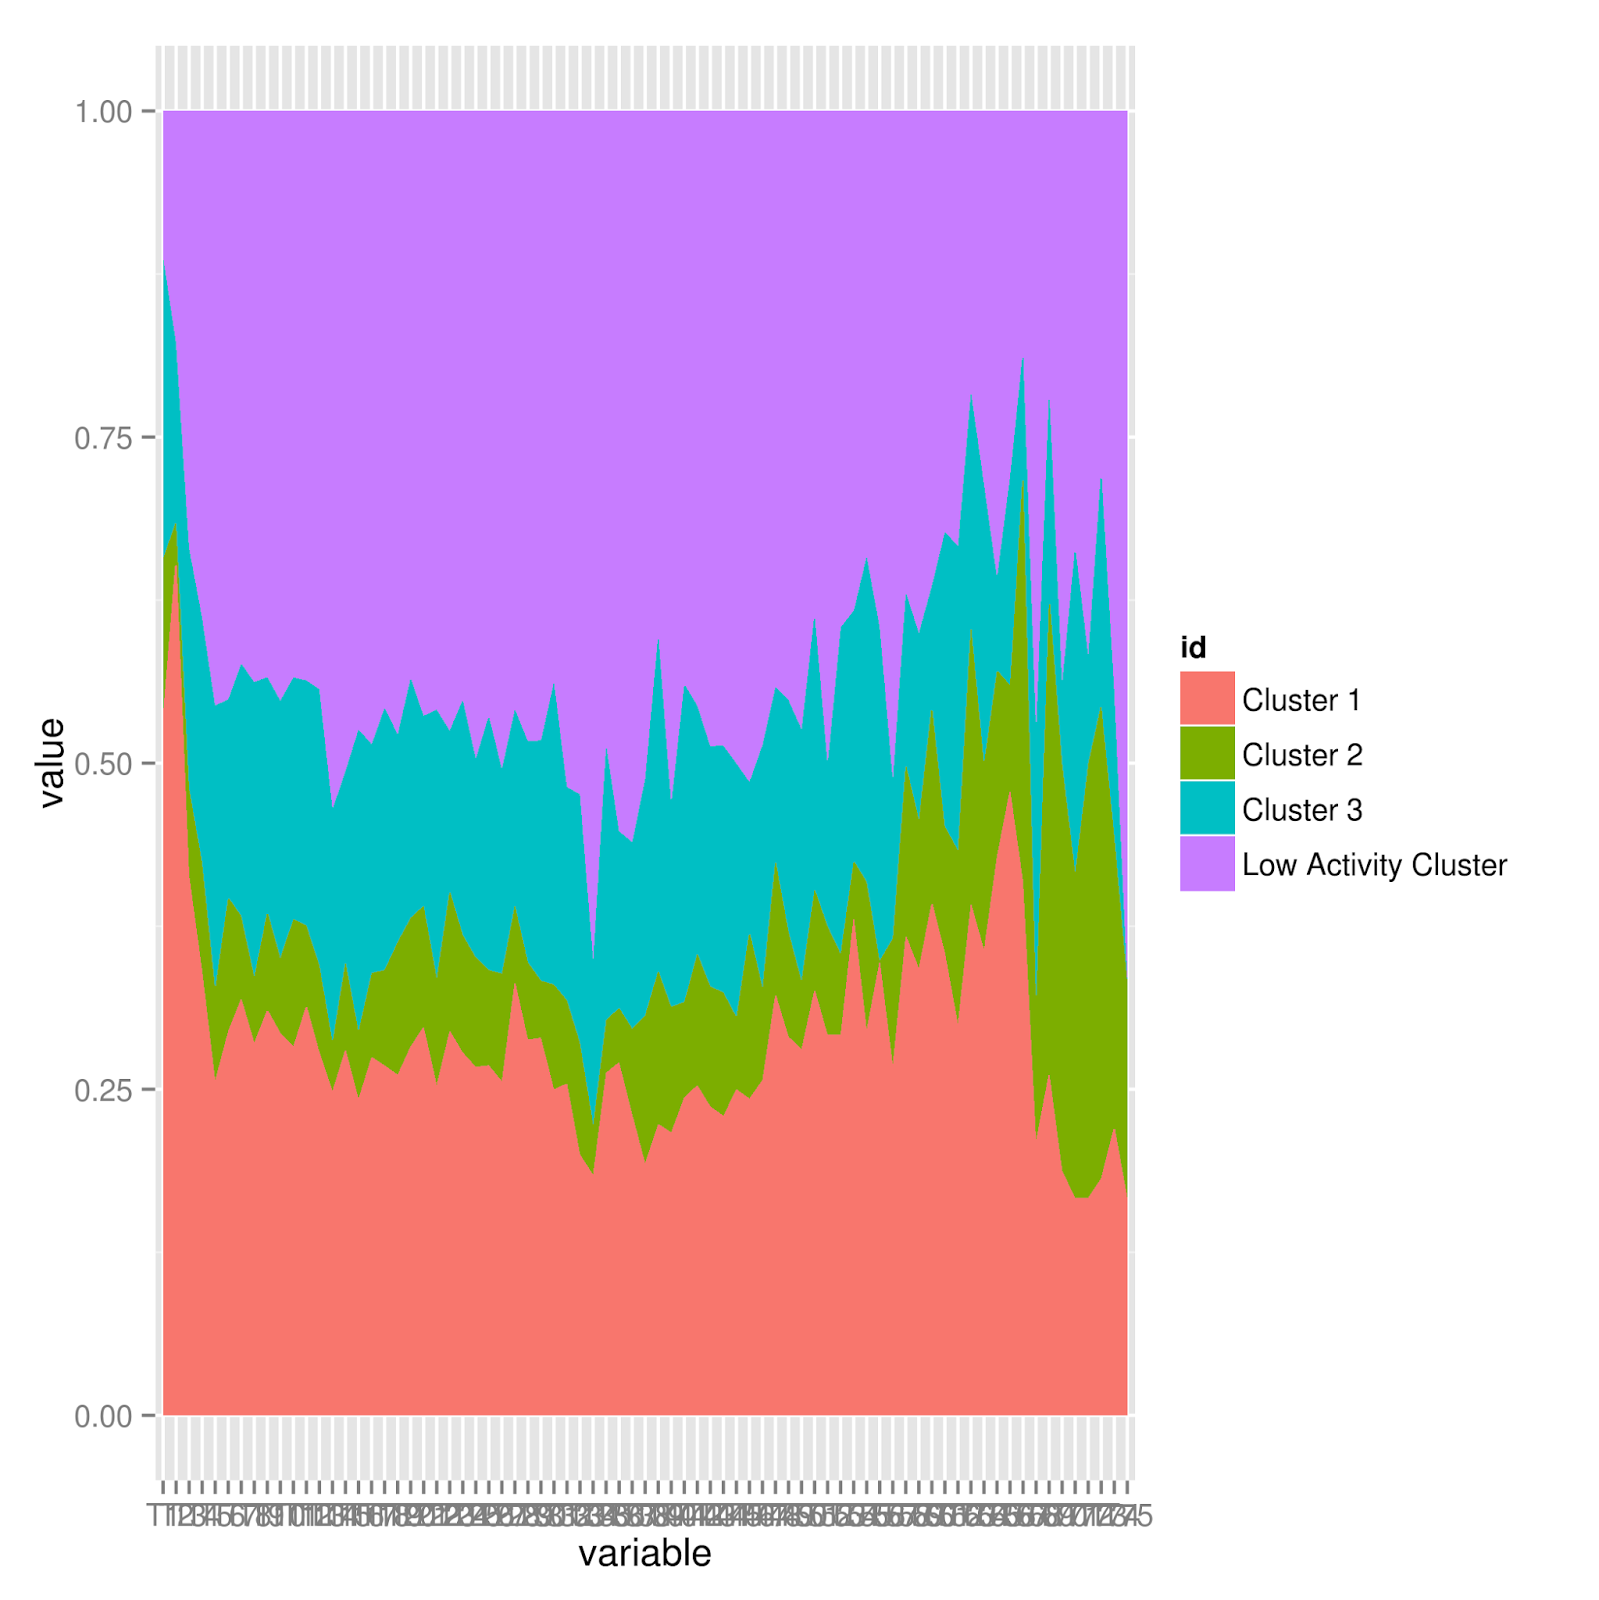
So, I thanks to some help from the very kind BrodieG on Stack Overflow, I was finally able to get some visualizations of the way that roles change over time. I am using the following code (as you can see, I tried to learn how to do melting and reshaping, then kind of gave up that hope - maybe another time).
</pre>And this is what the code produces (some new colors would probably be a good thing to work on next!) There are some interesting things going on here, but no clear movement into the central-type role (Role 1).
So, I use Vim to do all of my programming, as well as for writing my thesis. Despite how often I use Vim, I’m not really a very expert user (as you will soon learn).
So, it’s not uncommon that I will want to copy and paste a code snippet from a website (usually StackOverflow), either to use it in my own code, or to figure out how it works.
When you paste it into vim, it really looks terrible. Everything is indented like crazy, and it’s almost unusable. When it’s a small snippet, it doesn’t take long to fix it, but for longer pieces of code, it’s a huge pain.
I always thought that it was just some poor programming on StackOverflow - that they put in a bunch of hidden tabs or something. But, I came across this article today, and realized that the problem is actually how Vim handles the pasted text.
Basically, before you want to paste a hunk of indented text from somewhere else, run
:set paste
Then, when you are done pasting to your heart’s content, run
So, my main research question is about how people move through various roles in a community over time.
In the end, I will be using social network analysis as a driver for why people move through roles, but I will start with identifying what the roles are, and some summary statistics of how people move through them.
In order to identify roles, I created monthly activity snapshots for each user, and then used a clustering algorithm in R to automatically identify different “behavioral roles”. There is some evidence that the data don’t cluster cleanly, but clustering isn’t a central component of my research, so I am moving forward anyway.
I decided to use the k-mediods (aka “partitioning around mediods” or “pam”) algorithm in R. I used the silhouette function to identify the best k (which was 3 clusters).
The data I used to create the clusters only included those months where a user made at least 5 edits. So, I created a 4th cluster to represent months where a user made less than 5 edits, and used a python program to add the cluster results to the original stats file.
I then wrote another python script to rearrange this data, so that it is in the format
</pre>so that Month1 is the user’s role in their first month, Month2 the role in that user’s 2nd month, etc.
For way, way too long today I’ve been trying to get R to display this data as a stacked area graph of the ratio of roles by month. It’s been a huge pain to try to figure out how to reshape it, etc.
Once I can get that, I want to compare that graph to the graph of those who were in each role at least X times during their tenure.
I finally got a model that would converge in RSiena. My plan was to start with a simple model, and then to add more of my hypotheses once I got the simple model working. It turned out to be tough enough to get the simple model to converge that I just went with that once I had it working.
At Sunbelt, I went to a great workshop by Tom Snijders, which was very helpful. He also came to the poster session, and gave me some great tips about how to work with my model.
So, I’ve been reading more about how RSiena (and stochastic actor-oriented models) work, and I’ve been rethinking a few things. <h4>The Problem</h4>Basically, they are expecting both networks and behavior to be fairly similar between observations. For example, this paper says that <blockquote class="tr_bq">A dynamic network consists of ties between actors that change over time. A foundational assumption of the models discussed in this paper is that the network ties are not brief events, but can be regarded as states with a tendency to endure over time. Many rela- tions commonly studied in network analysis naturally satisfy this requirement of gradual change, such as friendship, trust, and coop- eration. Other networks more strongly resemble ‘event data’, e.g., the set of all telephone calls among a group of actors at any given time point, or the set of all e-mails being sent at any given time point. While it is meaningful to interpret these networks as indi- cators of communication, it is not plausible to treat their ties as enduring states, although it often is possible to aggregate event intensity over a certain period and then view these aggregates as indicators of states.</blockquote>While the RSiena manual says that: <blockquote class="tr_bq">In the models, behavioral variables can be binary or ordinal discrete (the extension for con- tinuous behavioral data is currently being developed). The number of categories should be small (mostly 2 to 5; larger ranges are possible). In the case of behaviors, Stochastic Actor-Oriented Models express how actors increase, decrease, or maintain the level of their behavior.</blockquote><h4>Some Ideas </h4>My plan is to create 4 different types of networks - observation, local communication, global communication, and collaboration - and to use these to try to predict how many edits a user would make.
I’m realizing that the way I’m measuring these networks, as well as measuring activity, do not match with the way that SAOM works. For example, someone who observes the work of another user only one time in a period (defined as being the next editor of a page) is quite unlikely to observe the same user again. That is, this definitely represents an “event” instead of a “state”.
I haven’t decided for sure what to do. My tentative plan is to change my observation network into a dynamic dyadic covariate. As I understand it, this would still test whether or not observing someone else’s page makes you more likely to be active.
I think that my other networks can be aggregated, and be made to represent states. That is, users who have communicated via talk pages X times in a period can be considered as having a “communicates with each other” link. <h4>Behavior has to change, too</h4><div>I definitely need to change my behavior variable, too. Like in most “peer production” environments, activity level follows a power-law curve, with a few users making lots of edits, and most users making a few. This makes this variable tough to model. I tried using quartiles, but even that is messy with this sort of data.</div><div> </div><div>For now, I’m thinking that I will use the number of days they were active (i.e., made an edit) in the period as a measure of activity. This has a clear max, and should have a much less skewed distribution. In addition, my research is situated in the theory of communities of practice, which says that as people join a community, it becomes part of not only what they do, but who they are. In this sense, I think that the days active measure represents how engaged someone is in the community, even if they aren’t making lots of edits.</div><div> </div><div> </div><div>P.S. For now, I decided to just keep my data as adjacency matrices, and not worry about converting it to edge lists. Maybe after I get my analysis done for the Sunbelt conference!</div>
So, I’ve been storing my networks on my computer as full matrices. I have 3 different networks I’m looking at, with monthly snapshots, over 5 years, so there are a lot of files, and the full matrices are bulky.
In reading the RSiena manual, I saw that the native Siena formula is an edgelist, in the format “senderID, receiverID, value, wave”. I thought that converting my matrices to edgelists in that format would really reduce the size of the files (not to mention being easier to debug as needed).
So, I’ve been trying to get RSiena to accept a very simple made-up edgelist that I created. It looks something like:
2 3 1 1 3 4 1 1 2 4 1 1 3 2 1 1 4 3 1 1 4 2 1 1
However, when I ran sienaDataCreateFromSession(‘../fakeEdgeList.txt’) I got: <pre></pre> Error in if (session$Type[i] == “exogenous event”) { : argument is of length zero
<div> </div><div>After re-reading the help(sienaDataCreateFromSession) file again, I realized that it’s actually expecting a sort of config file, and the file names are outlined there. So, I created my config file.</div> <pre>Group,Name,Filename,Format,Period,ActorSet,Type,Selected,MissingValues,NonZeroCode,NbrOfActors data1,observation,../fakeEdgeList.txt,Siena,,1 2,network,Yes,.,1,6</pre> I then got Error: could not find function "network.size"
I realized I needed to install the ‘network’ package.
However, I’m still not there. After install network, I get
<pre></pre> Error in network.size(namefiles[[1]]) : network.size requires an argument of class network.
So, for some reason, my file isn’t being converted to a network object, but I’m going to have to wait until Monday to try to figure out why. :)
I am a Master’s student at Purdue, working on my thesis project. For my project, I am looking at the edits made in the online genealogy community WeRelate, from the framework of Social Network Analysis.
My overall theory is that people in communities (like WeRelate) move through different patterns of behavior. For example, at first they are novices - they work mostly alone, and don’t do too much. As they learn more about the community and the technology, they start to collaborate more, do more work, and do specialized work.
My goal is to use machine learning (specifically clustering) to identify different “behavioral signatures”, and then to track how people move through those behavioral patterns. Specifically, I want to test how interactions with others affect how/whether/when people change their behavioral patterns. <h3>Purpose of this Blog</h3><div>In order to study this, I am using a number of tools that I have used only casually before. Namely, postgreSQL, R, and RSiena. While I have quite a lot of experience writing Python scripts to do data manipulation, the scale of this data is much larger than anything I’ve used before. There are 15.5 million edits that are tracked, stored in a giant XML document. I initially tried to manipulate the document directly with Python, but after far too much time spent waiting for my scripts to go through that giant file, realized that solution wouldn’t work, and I moved things into a PSQL database.</div><div> </div><div>I have a few goals for this blog:</div><div> </div><div><ol><li>To write down what I’m working on, which will hopefully motivate me to keep going.</li><li>To provide a resource for others who are trying to do similar things. For RSiena in particular, it’s been very tough to find beginner-level resources.</li><li>Ideally, to find some people who can give me advice and suggestions.</li><li>To prove to my wife (and committee) how hard I’m working. :)</li></ol>So, for the most part, my posts will be quite technical, outlining what I’m working on, and what I (have or haven’t) learned.</div>